

According to Proofpoint's 8th annual State of the Phish report, the volume of both bulk phishing attacks and spear-phishing attacks have gone up 11% and 20% respectively. While phishing attacks have been around for many years, only 53% of employees know what the term phishing is. We even saw a 16% year-over-year decrease in the correct answers.
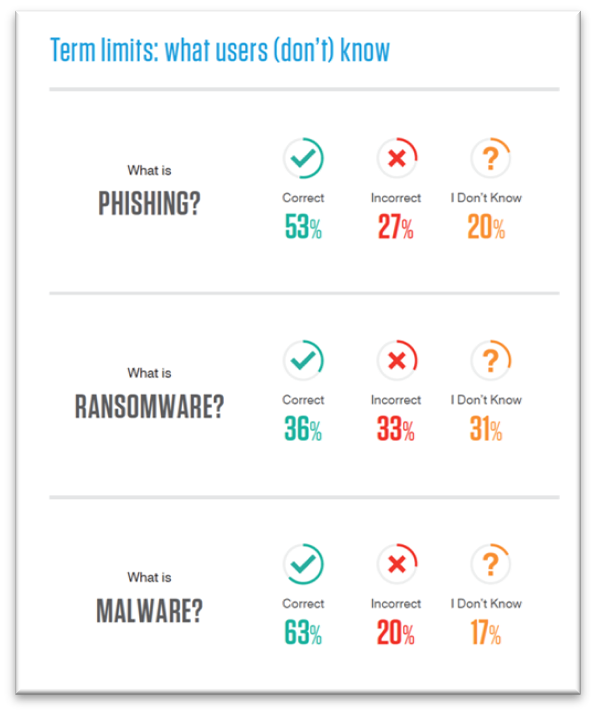
Figure 1: Only 53% of working adults got the correct answers on "What is ihishing." (Source: Proofpoint State of the Phish, 2022)
While the pandemic has put many different pressures on organizations—and some may even have been forced to deprioritize user security education programs (due to lack of time, resources, or other factors)—many organizations still try to train and track users' knowledge and skills in identifying phishing attacks. However, checking the box of "training completed" and/or reducing click rates of phishing simulations should not be the goal of your security awareness program.
As Gartner's 2021 Market Guide for Security Awareness says, "Security awareness is more than phishing simulation and computer-based training." We couldn't agree with the statement more. While tracking click rate of phishing simulations is a good starting point, as it gives you a good sense of how users would react when faced with potential threats, it doesn't tell you what users know or what they don't know.
In addition, solely relying on the click rate of phishing tests could be misleading. Think about it: not all phishing templates are considered equal. Some are more sophisticated than others; some could be more difficult for certain types of users. For example, people in the Accounts Payable department may be more likely to fall for a simulated invoicing fraud attack than application developers, given their roles. People in the HR department might be easier to trick by simulated fraudulent payroll redirect tests than people from other departments.
The click rate also varies by the average failure rate of the phishing template used. A common challenge for organizations that only track click rates of simulated phishing tests is the inconsistency in the phishing simulation results; click rate may drop in one quarter and then increase in the next quarter. That's because phishing templates have different difficulty levels. Click rate doesn't necessarily reflect the actual performance of your security awareness program. It's one metric, and it doesn't paint the whole picture.
While lower failure rates could be a positive sign, not clicking a simulated phishing email is not the same as actively rejecting it. Phishing tests might be ignored or avoided for any number of reasons, not just because users believe them to be suspicious. That's why you need your users to not only avoid the bad by resisting phishing baits, but also "do the good" by reporting them. And when they do so, you can confirm whether:
- Your users have the knowledge and skills to identify potential threats—are they reporting random email or are they reporting malicious email?
- Users are paying more attention to the emails they're receiving
- Users are taking intentional action to help protect your organization
- You have built trust with your users—they can turn to the Security Team if they feel something is off even if the email they reported turns out to be low risk
Hence, reporting rate should be another key metric for you to track on a regular basis. The ultimate goal is to increase user resilience over time, which occurs through improvement in how users respond to simulated phishing attacks.
As a very high-level rule, we recommend having a phishing reporting rate of 70% or higher for phishing simulations and a click rate of under 5%. This means an overall resilience factor of 14, which would put you in a very positive position of having a user base that is 14 times more likely to report a potential threat than to engage with one. This 70/5 ratio could be a stretch goal for organizations. It doesn't happen overnight, but it's achievable. You need to be patient, be consistent, and allow for improvements to come.
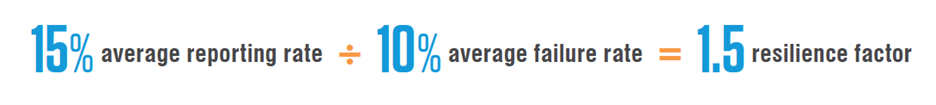
Figure 2: This is an example of how to calculate resilience factor
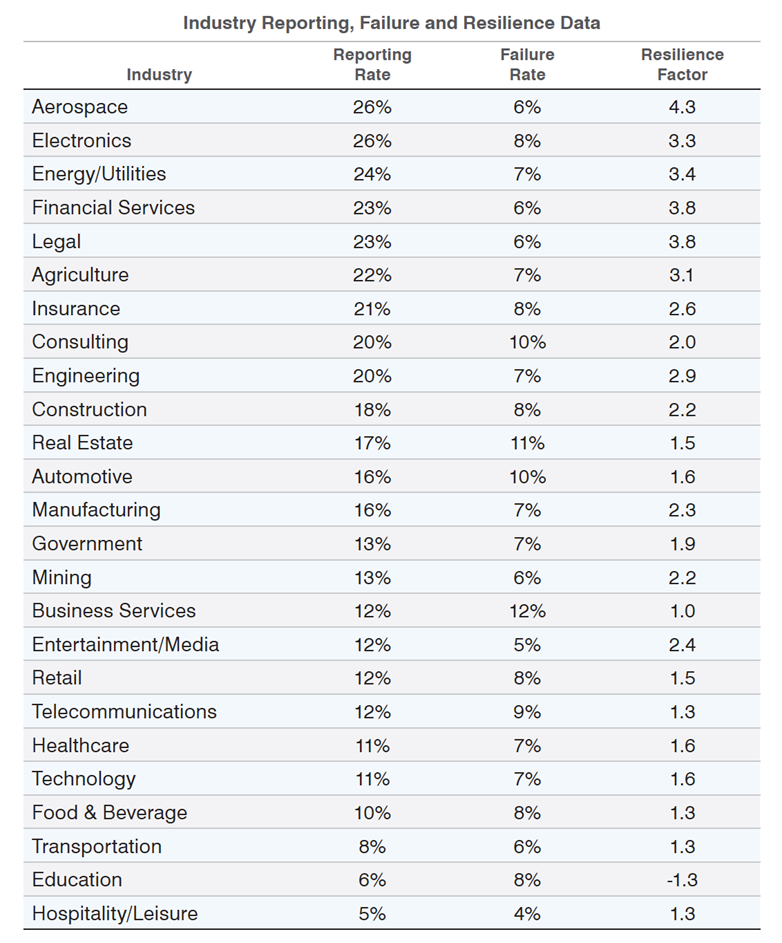
Figure 3: Proofpoint's 2022 State of the Phish report shows the average resilience factor (reporting rate divided by click rate) across industries. We encourage organizations to aim for a resilience factor of 14.
To learn more about email reporting, check out this eBook. Take the opportunity to transform attackers' favorite targets—people— into your strong line of defense.