C2 and the Docker Dance: Mythic 3.0’s Marvelous Microservice Moves
— Title by ChatGPT for introducing Mythic 3.0
What is Mythic?
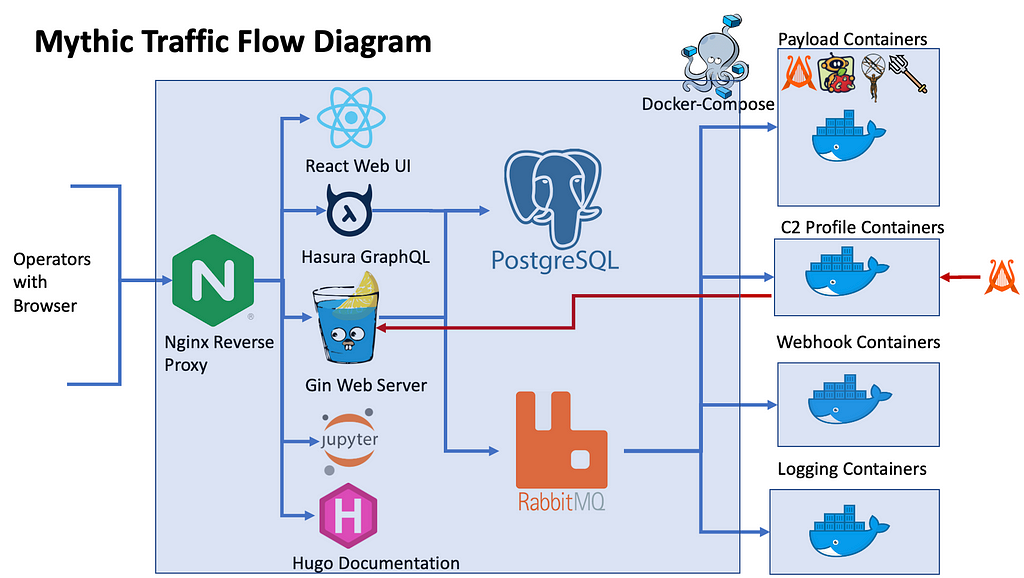
Mythic is a plug-n-play command and control (C2) framework that heavily leverages Docker and a microservice architecture where new agents, communication channels, and modifications can happen on the fly. Some of the Mythic project’s main goals are to provide quality of life improvements to operators, improve maintainability of agents, enable customizations, and provide more robust data analytic capabilities to operations. Mythic’s documentation is available online, and as the below image shows, Mythic’s many services are exposed to operators through a reverse Nginx proxy and maintained via Docker Compose.
If you’re curious about the various agents and communication profiles available within Mythic, a new overview site is available.
Why the update?
Why the big update to 3.0 instead of 2.4? Mythic 2.3 is based on Python3 and has legacy code from 2018 when the tool was first announced as Apfell. Normally that would be fine, but that was the time when Python3 was going through a transition to a new async/await model. As such, there weren’t a lot of libraries around that natively supported the new model. Mythic ended up using a few libraries pretty heavily that were wrappers around the new model which ultimately resulted in some pretty extreme, yet highly unpredictable errors. To update the original Python codebase to remove the libraries required edits to every file and every function. So, it became a perfect opportunity for a complete rewrite.
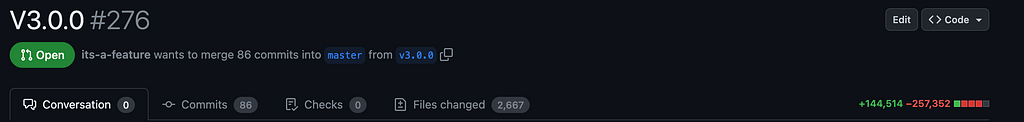
The entirety of Mythic’s back-end code was rewritten in GoLang. This provided a great opportunity to refactor, optimize, and extend the framework overall. Normally the minor version updates if there’s a breaking database change, but since there were database changes in addition to the rewrite, it made sense to bump the major version as well.


Of course that’s not the only change though. The next few sections will go over some of the updates, but a more complete list is available on Mythic’s documentation.
Build Steps
One of the big updates for Mythic 3.0 is to provide more context for operators throughout their operations. Part of this means letting operators know what’s going on behind the scenes when a payload is building. Historically, users see a spinning circle and have no idea if any progress is actually happening or if something happened to the build container.
Now, payload types can define a series of build steps and report back on their progress during build. Not only can payload types report back which step they’re currently on, but they can provide stdout and stderr along the way. This makes building payloads more informative as well as easier to troubleshoot.
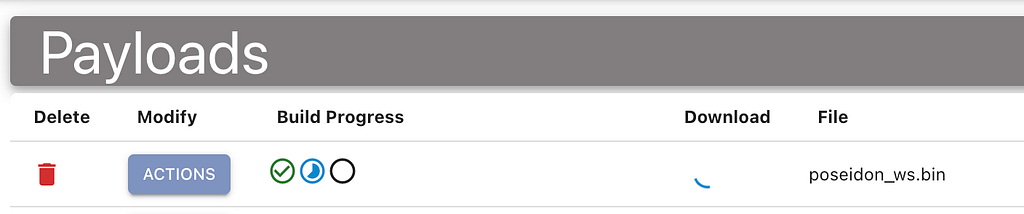
In the screenshot below, a Poseidon agent is building. It completed the first step (gathering all of the configuration parameters), and is currently running the build command for Golang.
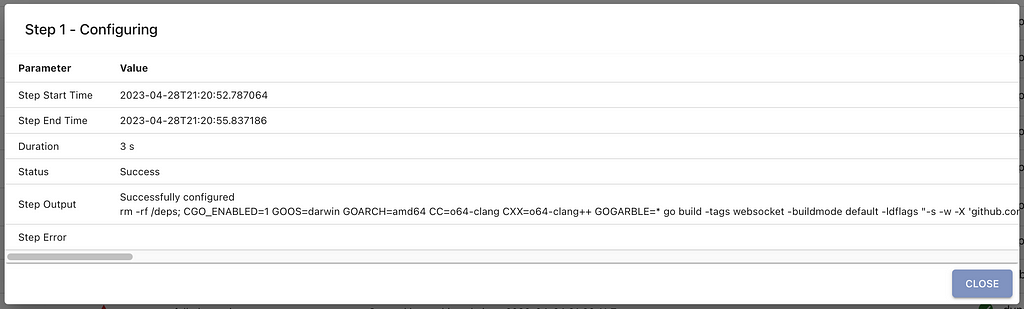
Clicking any individual step provides the stdout and stderr, but also includes the start and end times. This also gives operators more insight into how long it normally takes for various actions to take place. Building times can change wildly based on the resources of the host system where Mythic is deployed.
Updated Graph view groupings
Many C2 frameworks provide some form of graph view to help illustrate peer to peer (P2P) connections. While it’s useful to see that sort of call graph, it loses a lot of context about where the callbacks are coming from within an environment. Which ones are from the same host? Which ones are from the same user, but on different hosts? Which ones are the same operating system? The new grouping modes in Mythic’s graph view aim to answer some of these questions. In the following screenshot, we can see the egress path for a specific P2P callback (per-callback graphs like this are found by clicking the wifi/link icons in the active callbacks table).
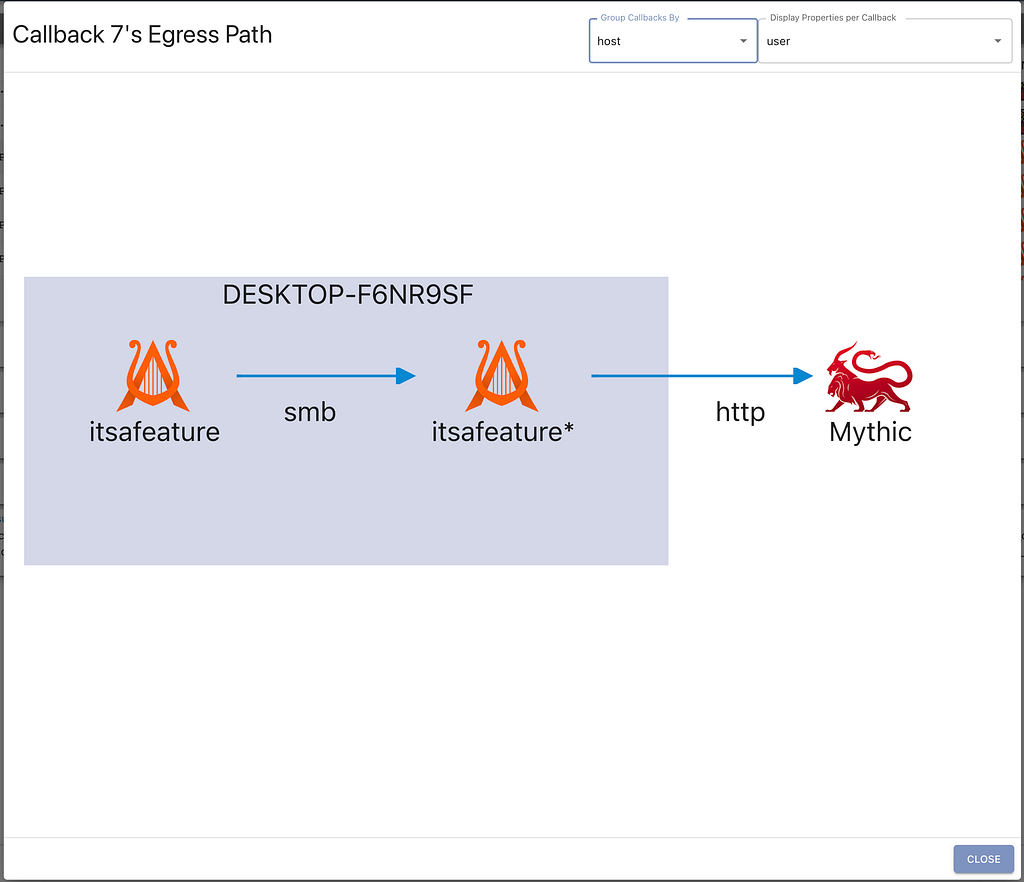
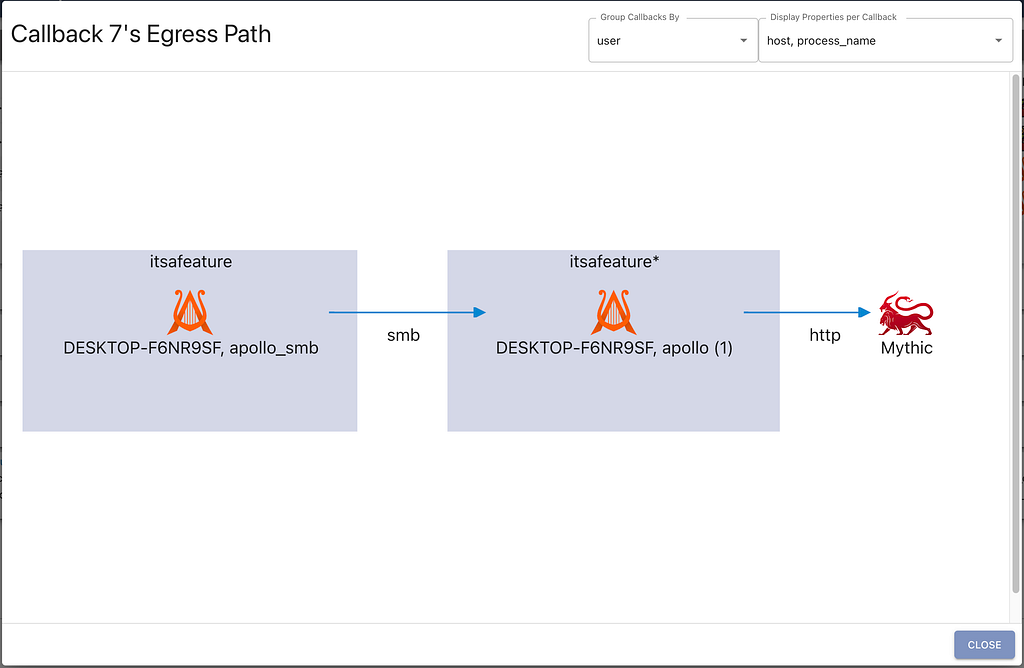
This current grouping shows that the two callbacks are on the same host, connected over SMB, and reach out to Mythic over http. We can also reorganize the view to group the callbacks by their user and display the corresponding host and filename for each one, as shown in the screenshot below. This applies not only to single egress paths like shown here, but to the graph for all active callbacks.
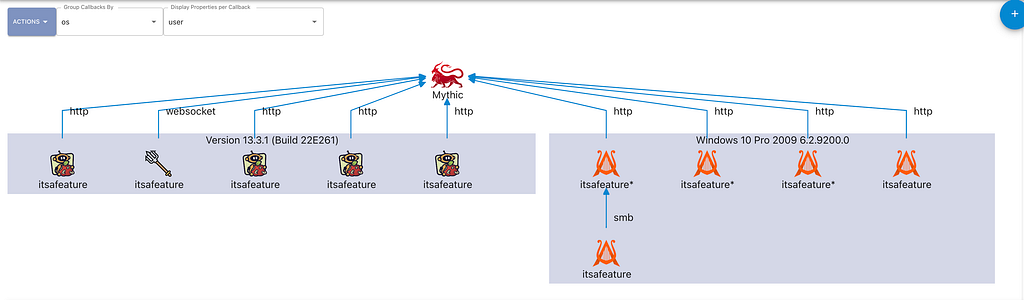
When looking across all active callbacks, the ability to adjust the grouping becomes way more meaningful. For example, what if we wanted to see all callbacks grouped based on the operating system version they’re running on? The following screenshot shows just that. Once you get a graph of what you’re interested in, the “Actions” dropdown has an option to export your graph as a PNG so that it’s easier to include in reports.
Jupyter Notebook
Mythic 2.2 used REST interfaces to support the user interface as well as its scripting. Mythic 2.3 introduced GraphQL for its API with a Hasura Docker container along side the older REST interfaces. Mythic 3.0 completely removes REST and only supports GraphQL. While GraphQL is extremely useful, it does have one major drawback — knowledge of the database schema is required.
Another issue with scripting in general is that new users don’t know where to start. To help with this, projects tend to have extensive README files or even things like readthedocs or wikis with examples and information. That’s helpful, but can very easily get out of date or have minor inconsistencies over time. Not only that, but users have to copy and paste a bunch of code to get things going, and they have to make sure their environment is set up properly. That can be a big enough hurdle that people don’t want to approach scripting.
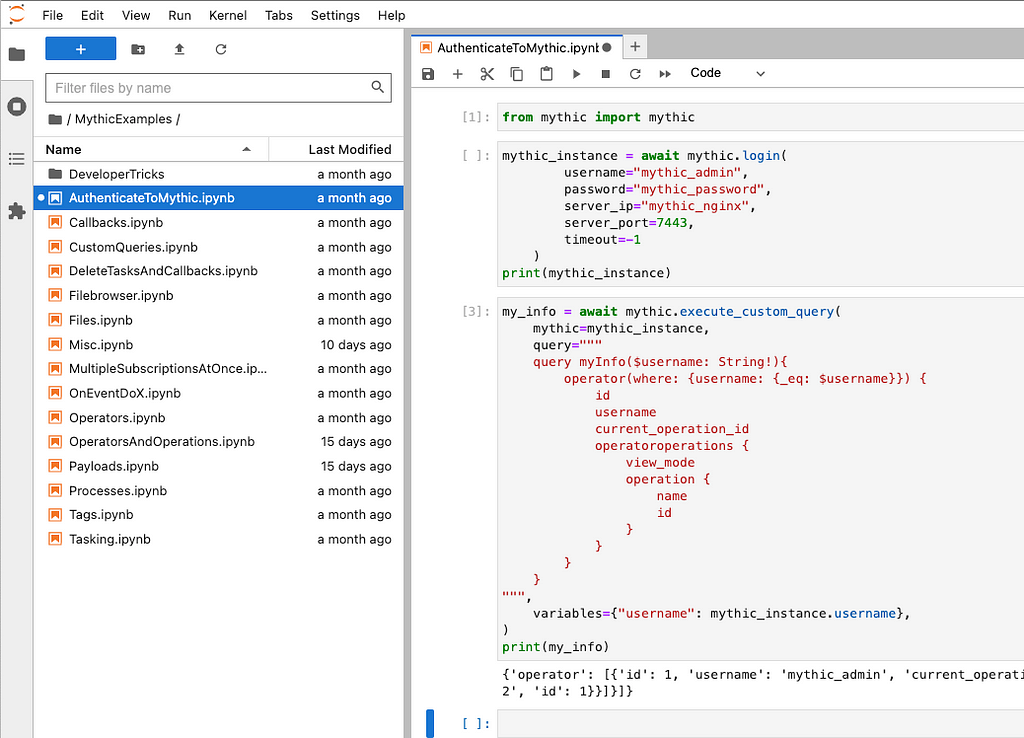
Mythic tries to solve these issues with a new Jupyter Lab Notebook container as part of Mythic deployments. The Jupyter notebook comes with Mythic’s scripting PyPi package, mythic, pre-installed along with all other required PyPi packages. As shown in the screenshot below, Mythic comes with many pre-created example scripts that work automatically and allow users to step through, section by section, to see outputs, test new flows, and more.
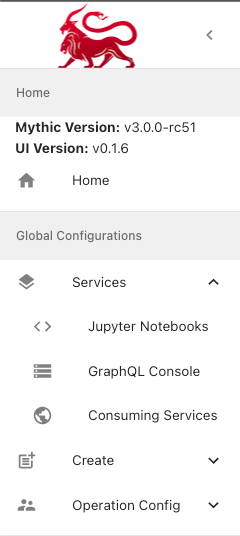
The other part of this is of course knowing the GraphQL Schema. Mythic has handy links to both Jupyter and the back-end Hasura console from anywhere within mythic:
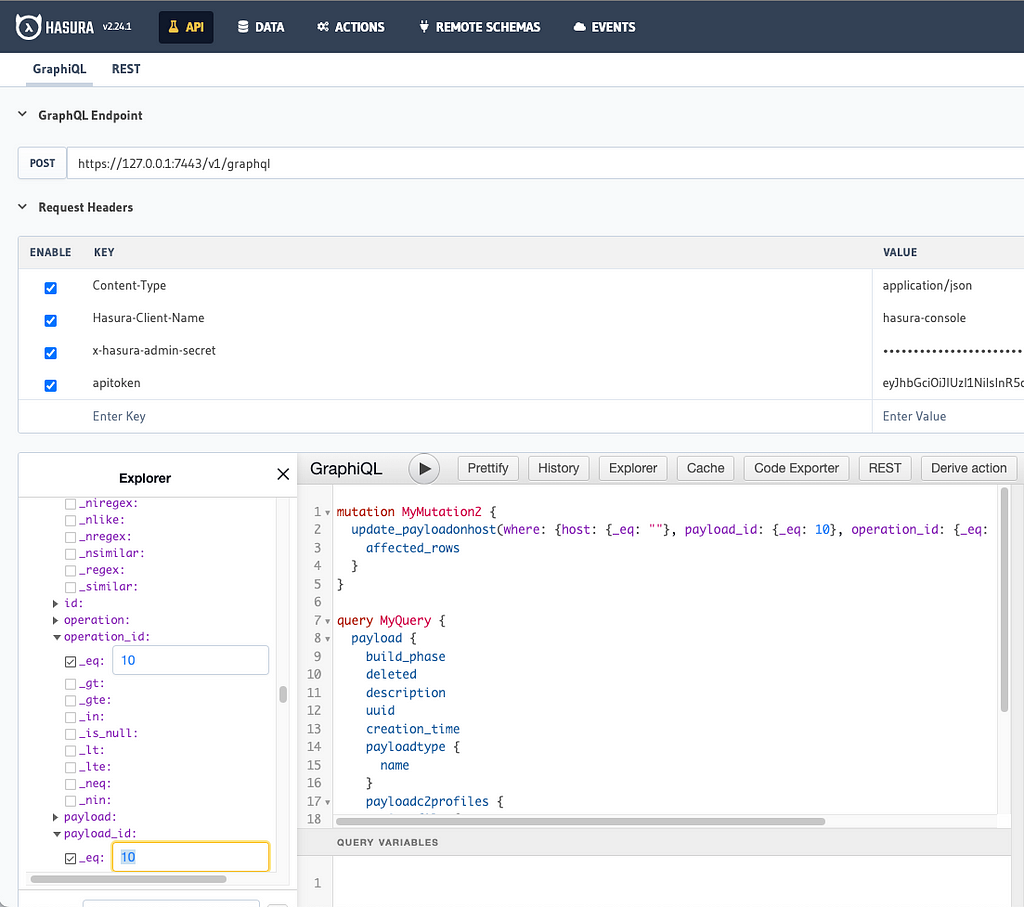
The API tab in Hasura’s console, shown below, allows users to graphically build out their own custom queries, updates, deletes, inserts, and streaming subscriptions before using them within Mythic scripting. Users can even supply their own apitoken as shown below to make sure that their exact user context will be able to do what they expect.
Another added benefit from the Jupyter container is that long-running scripts can execute on the Mythic server. That allows operators to connect and disconnect throughout the day and throughout an operation without breaking vital scripting functionality.
WebHook/Logging containers
With Mythic 3.0, more services are broken out into smaller, microservice components. This means removing things from the main Mythic server that can be the sole responsibility of other processes. Two main components that people often want to customize that can be split out are webhooks and logging. Many people want to customize the webhook location, data, and style for various aspects within Mythic. Similarly, people use a variety of SIEM/logging solutions that all expect logs to be formatted in slightly different ways. Now, with webhook and logging containers, operators have full customization over how those work. With this new freedom, Mythic is also providing more webhooks than ever. A basic webhook and logging container are available on the C2Profiles organization in GitHub.
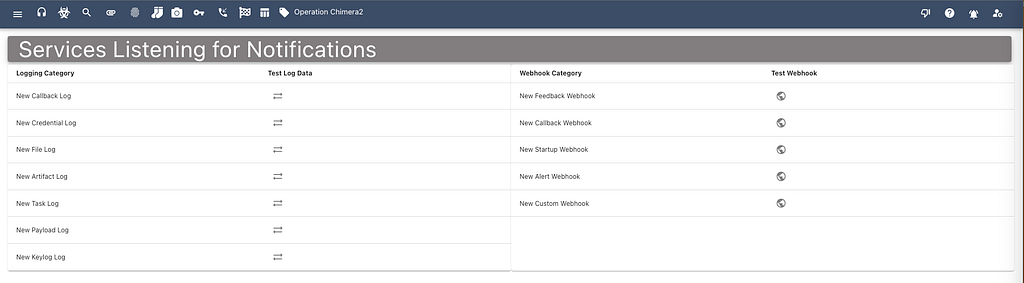
From the services dropdown in Mythic’s side menu, the “Consuming Services” page shows a list of all the things that consuming services (webhooks and loggers) can listen for and acton upon. In the below screenshot we can see the various events that cause new logs as well as which events can trigger webhooks. From this page, you can send a “test” message for any of these events to make sure that your services are handling the data properly.
There’s even a webhook for custom events which ties in to Mythic’s scripting. This means that as part of any Mythic scripting, you can trigger and send custom messages to your own webhook services. This provides a lot of flexibility for singular configuration with multi use.
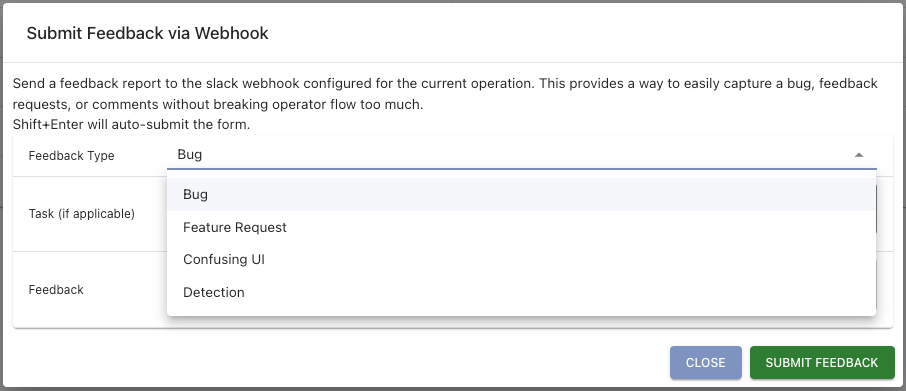
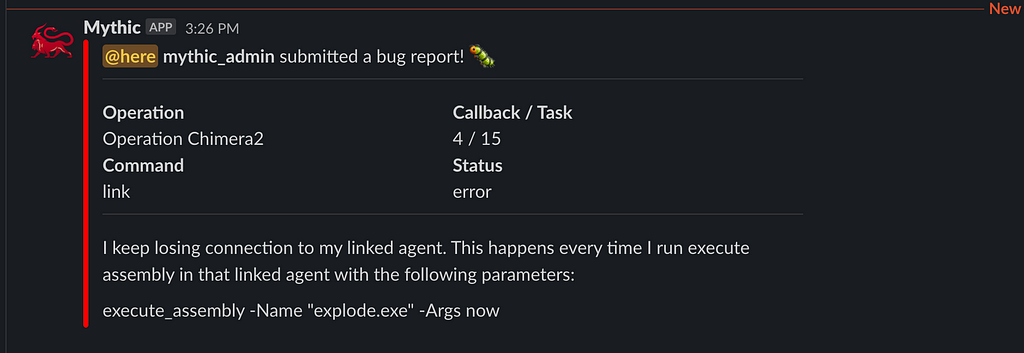
As part of this, Mythic 3.0 also wants to close the loop on operator/developer feedback. While operating, there might be a variety of things you think about such as a confusing interface element, a bug in how something works, an idea for a new feature, or even realizing that you’ve been caught in an operation. With the thumbs down icon at the top of Mythic, you can now submit all kinds of feedback to your webhook containers:
If you don’t have a webhook container installed, then none of these webhooks will go anywhere. Configuring a webhook URL and channel in the Mythic UI simply adds a default base case for a webhook container, but if there’s no container to consume the request in the first place, then nothing will happen.
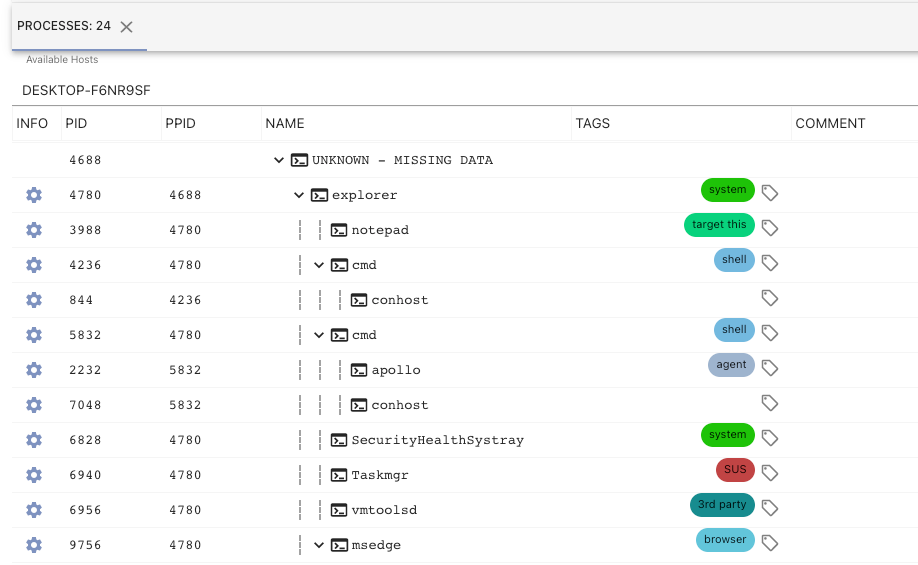
Process Trees
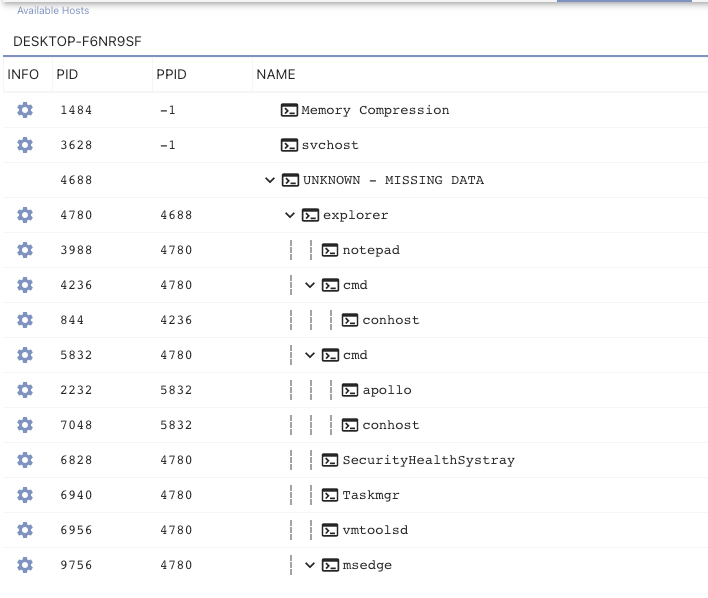
Mythic’s process tree viewer also got a facelift with Mythic 3.0. The below screenshot shows processes by host in a sortable and filterable table that includes an embedded tree. As shown below, we can see the process tree for a host named DESKTOP-F6NR9SF which contains missing data from the agent. The explorer process says its parent process identifier is 4688, but the agent never reported back information about that process. The tree will fill in missing data as best it can:
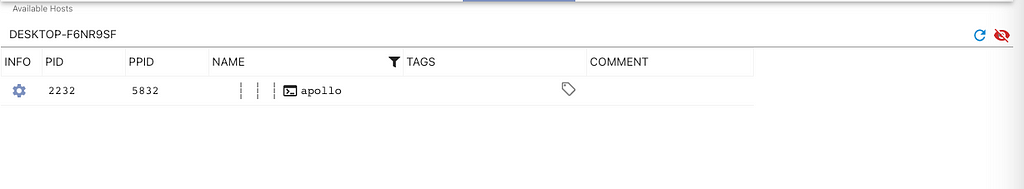
The more interesting update though is being able to view a single process tree at a time. If you right-click any of the column headers you can filter that column down and show/remove columns from view. If you’re looking for a specific process, it might be handy to filter down your view; unfortunately, when you do that, you’re missing a lot of contextual information as shown below.
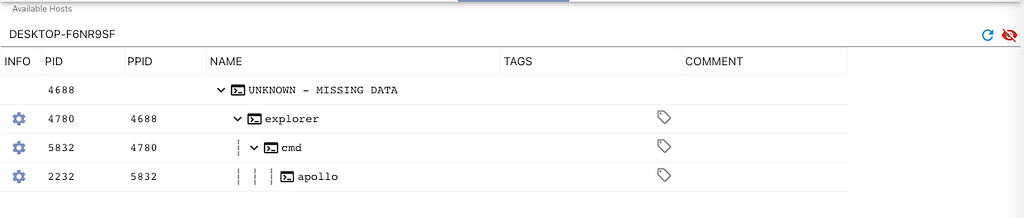
If we want to recover that missing information, we can click that blue cog icon and select “View Just This Process Tree”. Mythic then reconstructs the direct ancestors of that process and all children from that process for your view.
Tagging
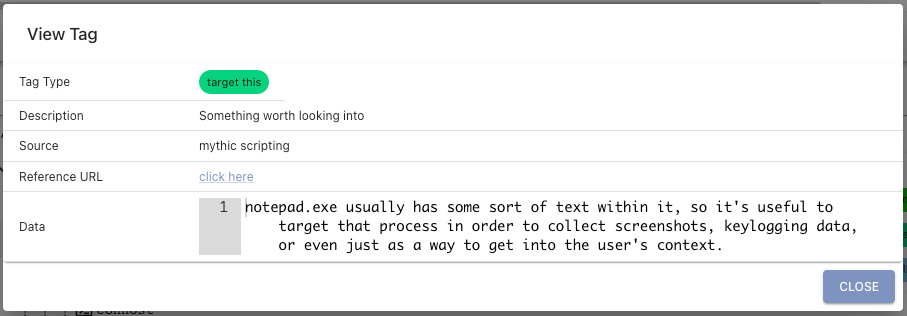
Mythic contained tags in version 2.3, but they weren’t heavily utilized and were squished behind the scenes. With Mythic 3.0, tags are brought forward more explicitly. So, what are tags? The following screenshot of a process listing shows an example:
Tags are small blobs of information associated with various aspects within Mythic (files, tasks, processes, credentials, keylogs, etc). These small components have a short display name, a description, and when associated with a piece of data, allow for more context. In the above screenshot, we can see that the apollo agent itself is tagged as agent and a few cmd processes are tagged as shell whereas a task manager process has the SUS tag. All of the tags themselves are fully customizable by going to the main tags page at the top of Mythic.
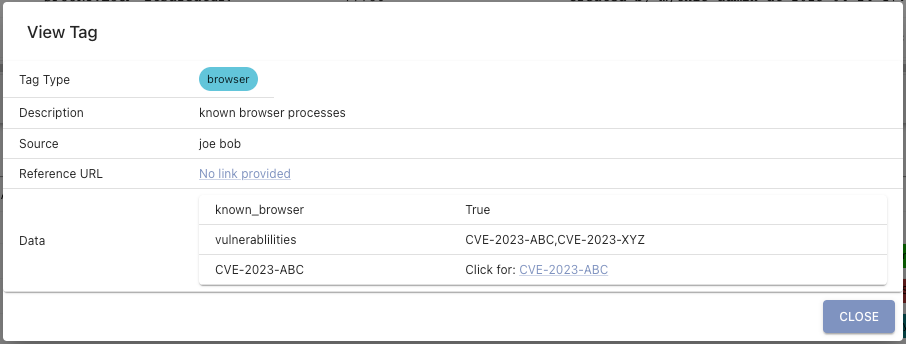
When clicking on a tag, you get more information about it such as the description of what the tag means, what created the tag, potential reference URLs for additional information, and even extra data as shown below.
If the data provided for the tag is JSON, then Mythic will actually render a table like below.
Mythic doesn’t do any of these tags by default, but operators can write scripts that listen for new events (like processes, files, etc), perform their own logic or borrow logic from things like this process highlighting script for Cobalt Strike, and automatically add these tags.
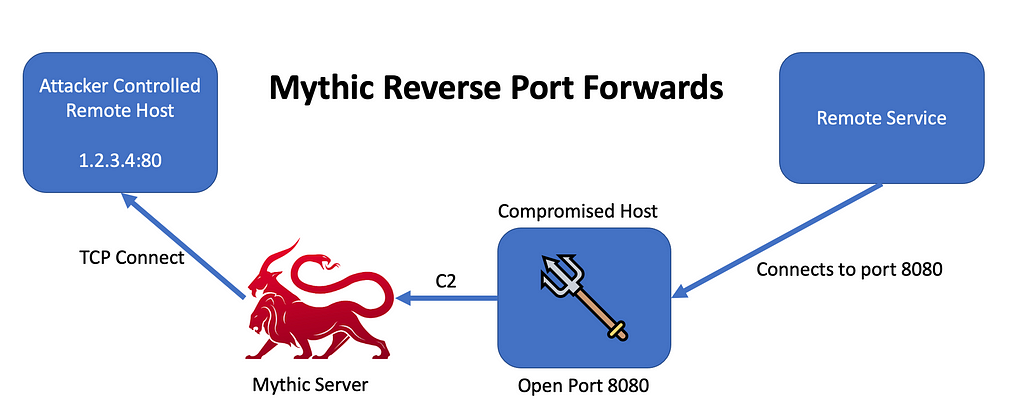
Reverse Port Forwards
Mythic now supports reverse port forwards in addition to SOCKS proxying. In reverse port forwards, the agent opens a port locally on the target machine. When the agent gets a new connection on that port, it forwards that information back to Mythic. Mythic then opens up a corresponding connection to a designated remote IP and port. From this point on, Mythic and the agent shuttle the data between these two connections.
Docker Updates
Since Mythic heavily leverages Docker and Docker Compose, it only makes sense to provide some updates about the Docker images available. Mythic 3.0 provides even more flexibility and control to developers, and in doing so allows the associated Docker images to be more generic. These Docker images are auto generated and pushed to DockerHub as part of a series of GitHub actions as shown below:
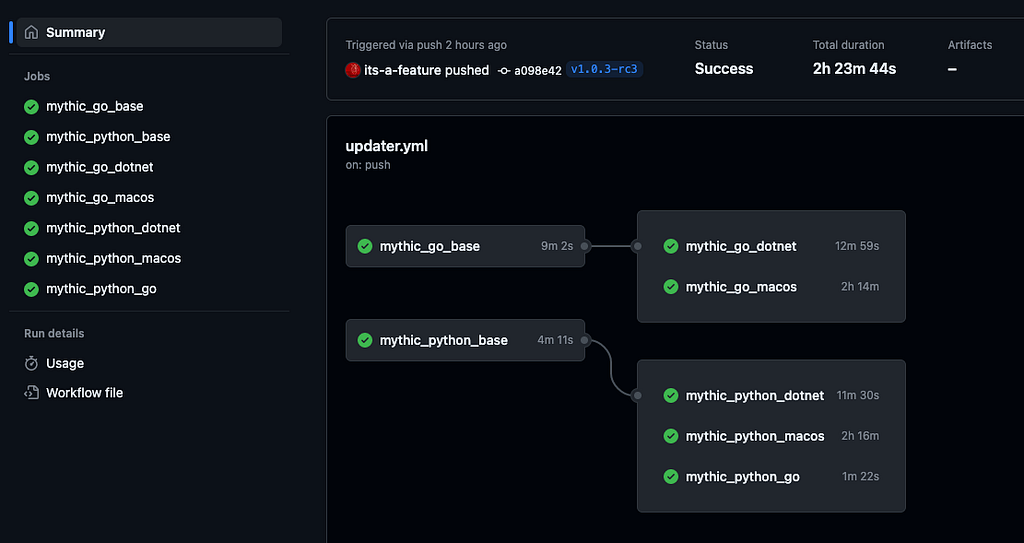
These images are broken out and named based on what they provide. There’s base GoLang and Python images that are then expanded to add more features like .NET and the macOS SDK. These are tagged with the latest major, minor, and patch tags along with a rolling :latest tag. In the future, the provided images might expand to offer more features like Nim or Rust depending on what’ll help the developer community.
As part of the dynamic creation of these Docker images, they all now support x86_64 as well as ARM_x64, which means that Mythic can now fully deploy on an ARM VM as well as an Intel VM.
Going Forward
Mythic is far from “done”. A few of the big things still on the horizon are:
- Operator and Developer Videos — A short video series aimed towards operators and another one for developers on common Mythic uses and developer tips/tricks.
- Async Interactive Tasks — This would allow providing follow-up information to a running task without requiring a full SOCKS connection.
- Custom Scripting Containers — Lightweight containers with custom scripting components to handle long-duration scripting actions. A good example of this would be to have a small container listen for new processes and automatically tag them.
- Push style C2 Profiles — Instead of having an agent repeatedly poll for tasking, this style of C2 Profile would hold open a connection for a callback and proactively push messages.
- Better BoF support — Provide an easier way for custom BoF execution within agents without requiring a new command definition file per BoF.
C2 and the Docker Dance: Mythic 3.0’s Marvelous Microservice Moves was originally published in Posts By SpecterOps Team Members on Medium, where people are continuing the conversation by highlighting and responding to this story.
*** This is a Security Bloggers Network syndicated blog from Posts By SpecterOps Team Members - Medium authored by Cody Thomas. Read the original post at: https://posts.specterops.io/c2-and-the-docker-dance-mythic-3-0s-marvelous-microservice-moves-f6e6e91356e2?source=rss----f05f8696e3cc---4