Automated network monitoring involves scanning for device component failures and examining traffic patterns. Learn how to lighten the load of your network management responsibilities.
Network monitoring tools provide automated network discovery and often also draw up network topology maps. The field is divided into two types of tools: network device monitoring and network traffic analysis.
Network device monitoring is often also referred to as network performance monitoring. The standard implementation of this type of system is to deploy the Simple Network Management Protocol. This gathers status reports from network devices and allows devices to send out emergency warnings.
Here is our list of the best network monitoring tools:
- Datadog Network Monitoring (FREE TRIAL): This cloud-based system is divided into a device tracker and a traffic monitor with a combined package also on offer. Start a 14-day free trial.
- SolarWinds Network Bandwidth Analyzer Pack (FREE TRIAL): A combination of two SolarWinds products: the Network Performance Monitor for SNMP-based device health monitoring, and the NetFlow Traffic Analyzer for traffic statistics extracted with flow protocols. Runs on Windows Server. Get it on a 30-day free trial.
- ManageEngine OpManager Plus (FREE TRIAL): This large bundle includes network device and traffic monitoring plus network configuration monitoring, switch port mapping, and IP address management. Available for Windows Server and Linux. Get a 30-day free trial.
- Site24x7 Network Monitoring (FREE TRIAL): Provides device monitoring and traffic analysis as part of a full-stack operability package that is delivered from the cloud. Start a 30-day free trial.
- Paessler PRTG Network Monitor (FREE TRIAL): A flexible package that offers network discovery, SNMP-based device health tracking, and traffic monitoring with flow protocols, among other functions. Available as a SaaS platform or for installation on Windows Server. Start a 30-day free trial.
- Zabbix: A free IT asset monitoring package that includes network discovery, device status tracking, and traffic analysis. Runs on macOS, Linux, and Unix.
- Icinga: A flexible monitoring package that includes network device and traffic monitoring. Runs on Linux, Windows, or AWS.
Network traffic analyzers are also known as bandwidth monitors. This category of tool interfaces with switches and extracts the statistics that those devices gather during operations. The format of these metrics is defined in a number of different standards – the major network device manufacturers produce their own protocols and there are also a number of vendor-neutral standards. These protocols record data throughput rates per interface.
The Simple Network Management Protocol
The Simple Network Management Protocol (SNMP) is a very widely implemented standard. It is so common that all of the network device manufacturers ship their equipment with SNMP software already installed. This is called the SNMP agent, and sometimes, it is disabled by default. So, the first thing a network manager needs to do when starting network device monitoring is to ensure that the SNMP agent is activated on each device.
SNMP can also monitor endpoints. Both Windows and macOS include an agent. This is disabled by default, so it needs to be switched on. Linux distros don’t include an SNMP agent, so you will have to install one.
The SNMP agent scans the device that hosts it continuously. The agent’s job is to fill out a form, which is called a Management Information Base (MIB). This is a tree hierarchy coding system with a dot-notation code representing each characteristic heading. The device agent fills in a value for each heading.
The SNMP agent does nothing with its MIB but just continues to update its values. It also listens on the network for an SNMP Request. When one arrives, it sends its MIB to the originator of the request. This is called the SNMP Response.
The SNMP agent is one of the two roles that are defined in SNMP. The other is the SNMP Manager. This is the computer that sends out the SNMP Request and receives the SNMP Response. The protocol doesn’t define any other duties for the SNMP Manager. However, the usual task is to compile the values in the MIB into meaningful statistics. The Request is sent across the network as a broadcast. So, the SNMP Manager doesn’t need to know any of the addresses of network devices to start operations. However, the response includes this information, so the protocol is frequently used for network device discovery.
The SNMP agent can send out its MIB without waiting for a request if it identifies a component failure on its device. This is called an SNMP Trap and it is interpreted by most network device monitoring systems as an alert.
Network Flow Protocols
Flow protocols are used by switches to compile traffic statistics and store them as they accumulate. External software can query this data but they need to form their queries in the language specified by the protocol. There are several proprietary protocols in operation at the moment. The most widely used are NetFlow, by Cisco Systems, J-Flow, which was created by Juniper Networks, and NetStream, which is a proprietary standard of Huawei.
Of the three main proprietary protocols, NetFlow is the most widely implemented because Cisco published the standard so many minor device producers use it. These are IPFIX, an evolution of NetFlow, designed by Cisco Systems but maintained by the Internet Engineering Taskforce, and sFlow, created by InMon Corp and maintained by sflow.org.
Flow protocols report on traffic throughput per device interface. The protocol also notes the full capacity of each interface, so if that maximum is hit, it can be assumed that there is traffic that is failing to get through the overloaded switch. Most network traffic monitoring systems will operate an alert threshold on a percentage of utilization, such as 70 or 80 percent.
The best network monitoring tools
You can choose whether to focus on network device monitoring or traffic analysis when automating network monitoring. However, you can go one better and find a system that provides both.
Our methodology for selecting network monitoring tools
We reviewed the market for network monitoring tools and assessed currently available packages with the following selection criteria:
- Network discovery and hardware inventory creation.
- Constantly updated network documentation.
- The capability to communicate with switches in a long list of flow protocols.
- The ability to communicate in several flow protocols simultaneously to operate in multi-vendor environments.
- Customizable alert thresholds for switch interface capacity utilization.
- Alerts for Traps.
- A free trial or a demo for an assessment opportunity before paying anything.
- Value for money from a comprehensive package that is suitably priced given the quality of services on offer.
With this set of criteria, we thinned down the list of candidate network monitoring tools to a shortlist of packages. We made sure to include both on-premises software and SaaS platforms.
1. Datadog Network Monitoring (FREE TRIAL)
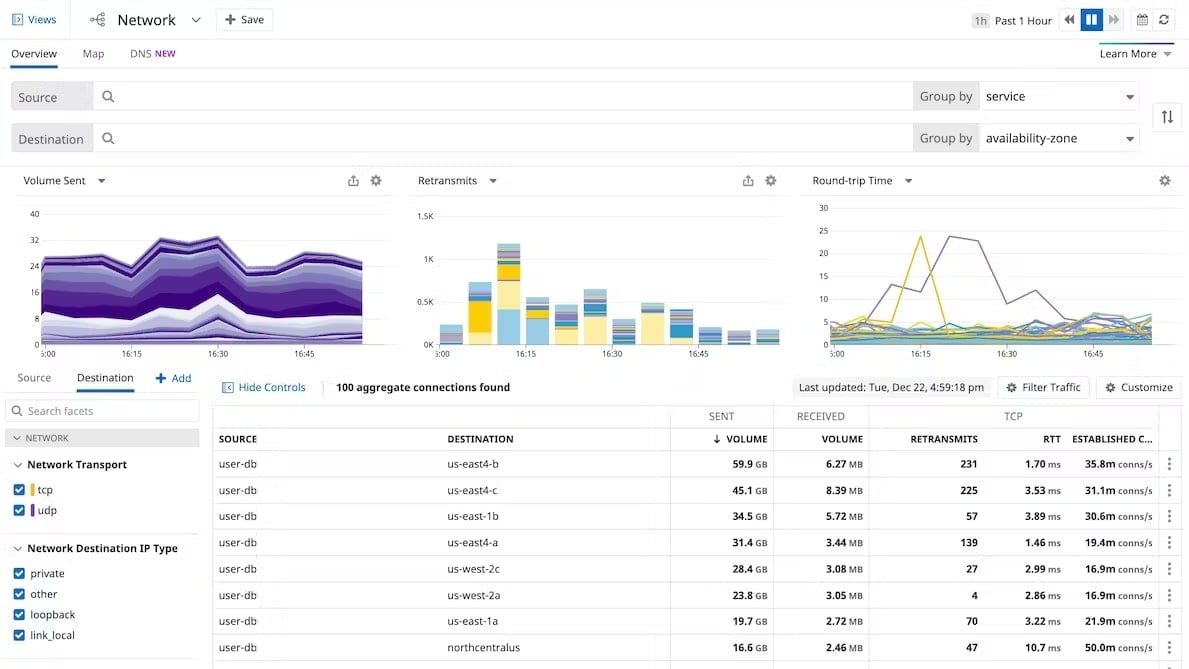
Datadog Network Monitoring is provided in two modules. The SNMP-based device heal checker is called the Network Device Monitoring unit and the Network Performance Monitoring option is a NetFlow-based traffic monitor. Datadog also offers a combined package, which is the Network Device Monitoring service with added NetFlow.
Key features:
- Cloud-based system: Installs a data collector on the enrolled network
- SNMP network scanning: The data collector acts as an SNMP Manager
- Multi-vendor networks: NetFlow, J-Flow, sFlow, or IPFIX
- Network services monitoring: Tracks the performance of DNS and other services
Why do we recommend it?
Datadog Network Monitoring is probably the best choice for a network monitor delivered as a SaaS package. So, those companies that are attracted by the efficiency of cloud-based subscription services should look at this package before all others. The division between device monitoring and traffic tracking follows the classic structure of the monitoring industry.
Both Datadog network monitoring modules rely on the Infrastructure Monitoring unit for its autodiscovery mechanism. You can enhance system understanding by combining the network monitors with other modules on the platform, such as Synthetic Monitoring and Real User Monitoring for websites.
Who is it recommended for?
The cloud-based system is good for companies that use wireless networks and cloud services, as well as on-premises systems, because the package can monitor all of those technologies. The system will also track virtualization and container performance. The plans are scaleable with a rate per host, which makes the package affordable for businesses of all sizes.
Pros:
- Network mapping: Live network topology maps are based on data held in the network inventory
- Continuous status monitoring: Both the SNMP and flow-based data collection repeat continuously
- Adjustable alert thresholds: Out-of-the-box performance expectation thresholds that can be adjusted
- Notifications: Forwards alerts as notifications by email, SMS, PagerDuty, or Slack
Cons:
- You also have to subscribe to the Infrastructure Monitoring modules: Infrastructure Monitoring provides the autodiscovery routine
All Datadog modules can be assessed with a 14-day free trial.
2. SolarWinds Network Bandwidth Analyzer Pack (FREE TRIAL)
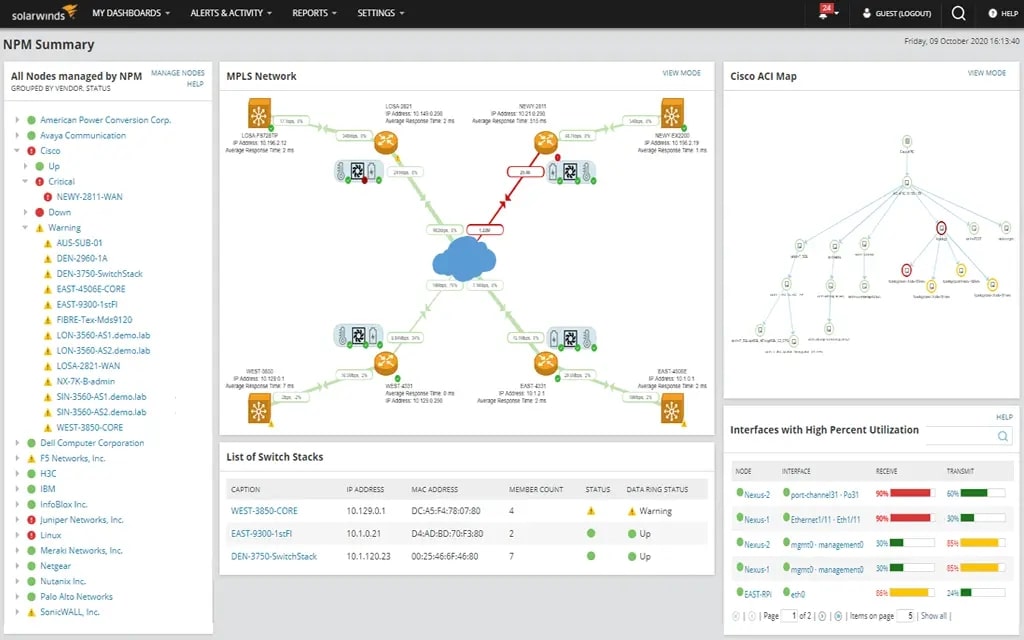
The SolarWinds Network Bandwidth Analyzer Pack is a bundle of the Network Performance Monitor and the NetFlow Traffic Analyzer – the two main network monitoring packages from SolarWinds. The Network Performance Monitor is an SNMP-based device health monitoring system and the NetFlow Traffic Analyzer uses flow protocols to record traffic patterns, identify bottlenecks, and alert to overloaded switches. Both elements of this package install on Windows Server.
Key features:
- Automatic network discovery: Compiles a device inventory that is constantly updated
- SNMP device monitoring: Provides an SNMP Manager
- Flow protocols: NetFlow, Juniper J-Flow, sFlow, Huawei NetStream, and IPFIX
- Monitors wireless: Both wired and wireless networks
- Alerts for performance issues: Forwarded as notifications by email or SMS
Why do we recommend it?
The SolarWinds Network Bandwidth Analyzer Pack is a megapack that covers all aspects of network activity. The tool will spot physical problems with network devices and also identify inefficiently planned networks through flow protocols. The system can show the reasons for issues such as jitter, latency, and lost packets, clarifying the solutions that will end those problems.
The Network Performance Monitor sets itself up through its network discovery routine. This creates a network inventory and also draws up a network topology map. The Network Traffic Analyzer adds live throughput volumes and speed to each link. This enables network managers to see which links are overloaded and which are underused. Reference to the device health screen could explain the reasons for these problems.
SolarWinds Network Bandwidth Analyzer Pack provides both device health tracking and traffic monitoring. This gives the buyer a complete network insurance system. The pack includes both SNMP and flow protocol mechanisms. The system improves technician productivity because the network is expected to run normally most of the time and only needs attention when things go wrong. Thus, the software performs all of the OK-time monitoring, calling in the technician only when human intervention is needed. This is an on-premises package, so it will appeal to large companies that aren’t willing to use cloud-based monitoring systems.
Who is it recommended for?
This package is very comprehensive and it provides network troubleshooting tools as well. Features in the plan also provide tests for internet connections. Network managers can test the performance of paths through the network as well as examine each individual link. The system is not free and its price tag pushes its appeal to large companies with complex networks.
Pros:
- Network testing tools: Link examination and path tests
- Continuously updates: Rescans the network regularly and updates the inventory and map with new discoveries
- Monitoring automation: The alerting mechanism means that you can assume everything is OK unless you get notified
- Multi-vendor operations: Can communicate with switches from different suppliers simultaneously
- Protocol analysis: Can report on traffic statistics per protocol
Cons:
- Only available on-premises: There is no SaaS version
The SolarWinds package is available for a 30-day free trial.
3. ManageEngine OpManager Plus (FREE TRIAL)
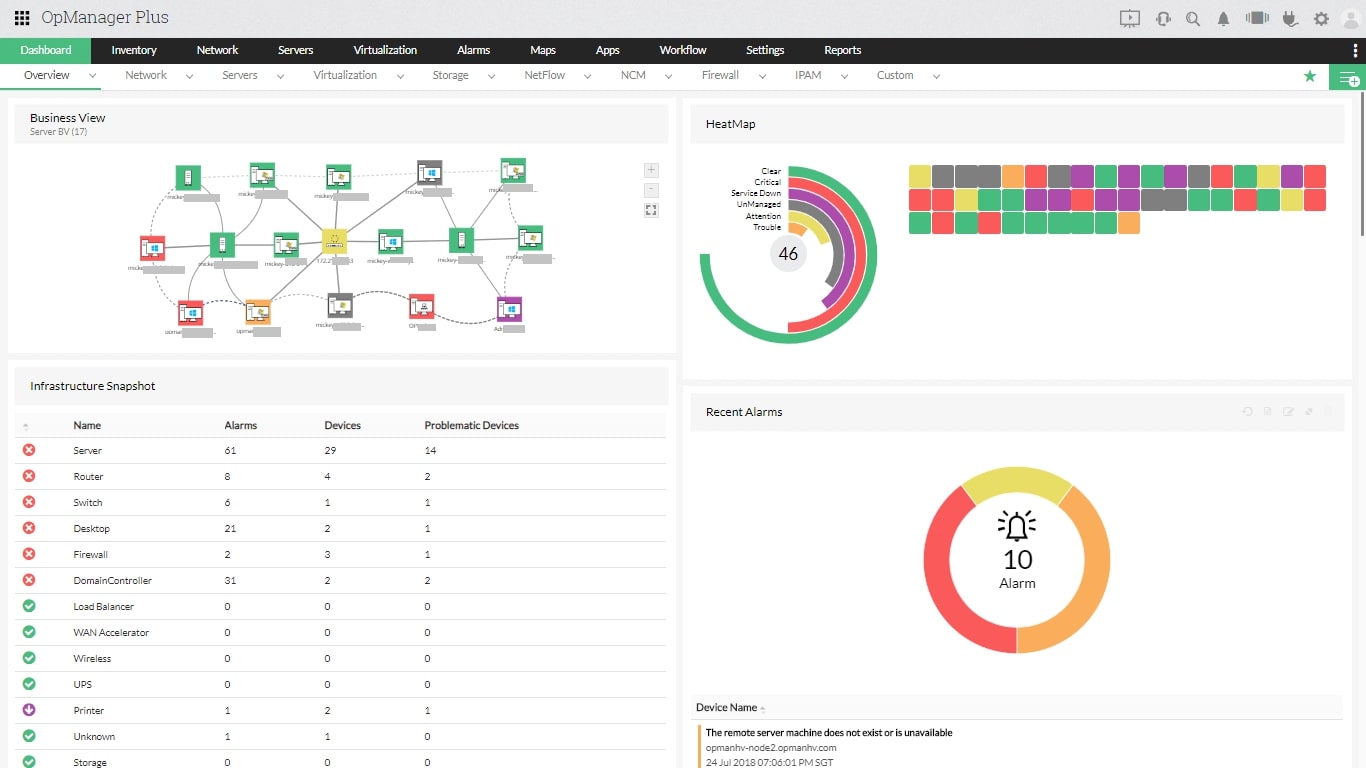
ManageEngine OpManager Plus is a bundle of ManageEngine modules. The system provides network discovery, hardware inventory, and maintenance, plus network topology mapping. You get both network device monitoring and traffic analysis in this package. Other features include server monitoring, network configuration management, switch port mapping, and IP address management.
Key features:
- SNMP device monitoring: Provides network discovery, inventory documentation, and network topology mapping
- Network flow protocols: Netflow, sFlow, J-Flow, IPFIX, NetStream, and AppFlow
- Traffic analysis metrics: NBAR, Class-based Quality of Service (CBQoS)
Why do we recommend it?
ManageEngine OpManager Plus is a large package of tools that provides all of the monitoring tools that a network manager needs. These include systems for tracking VoIP connection quality and virtualization monitoring. The package can monitor connections over the internet and record the performance of wireless connections as well as device and traffic monitoring for LANs.
The software bundle provides traffic breakdowns, such as top talkers and protocol analysis. It lets you test paths across the network and analyze traffic over time. The system will raise an alert if traffic surges or if SNMP spots a device error.
Who is it recommended for?
This package is suitable for complex, multi-site networks, particularly those that include wireless sections and use virtualizations, containers, and VoIP. The bundle includes network management utilities, such as its network configuration manager and IP address manager. If you don’t need all of these features, investigate the OpManager and NetFlow Analyzer modules from ManageEngine.
Pros:
- Network problem alerts: Can be forwarded as notifications by email, SMS, or Slack
- Also monitors servers: Exend delivery performance testing through to the user
- Network management: Network configuration management and an IP address manager
Cons:
- No SaaS option: Installs on Windows Server or Linux
This large bundle is an on-premises software package and you can download it for a 30-day free trial.
4. Site24x7 Network Monitoring
Site24x7 Network Monitoring is a cloud-based service that offers both SNMP-based network device monitoring and bandwidth analysis with flow protocols. The platform sells plans that include many modules. Typically, you will get server, application, cloud platform, and website monitoring added in with the network monitoring services. You also get log management and a network configuration manager.
Key features:
- Network discovery: Generates a hardware inventory and network map
- SNMP monitoring: The cloud-based system downloads a data collector
- Flow protocols: NetFlow, J-Flow, sFlow, CFlow, IPFIX, NetStream, and AppFlow
Why do we recommend it?
Site24x7 Network Monitoring is a good choice for those who prefer cloud-based systems. It is a strong competitor to Datadog and was created by the team behind the ManageEngine monitoring tools. The combination of automated discovery and system documentation with SNMP and flow-based network monitoring makes this a strong contender.
Features in the Site24x7 plans provide monitoring for virtualizations, containers, cloud platforms, internet connections, and wireless systems as well as LAN monitoring. The console is accessed through any standard Web browser and screens can be customized.
Who is it recommended for?
Site24x7 sizes and prices its plans to be accessible to small businesses. Capacity expansion charges make the tool suitable for use by mid-sized and large companies. There is a multi-tenanted version that is designed for use by managed service providers. This platform will appeal to businesses that prefer its plan pricing strategy over the module-by-module subscription model of Datadog.
Pros:
- VoIP connection monitoring: IP-SLA, Mean opinion score, and Quality of Service
- Wireless monitoring: Signal strength and throughput measurements
- Performance alerts: Notification by email, voice call, or SMS
Cons:
- Extra charges can build up: Calculate your expected bill before signing up
You can try any Site24x7 plan with a 30-day free trial.
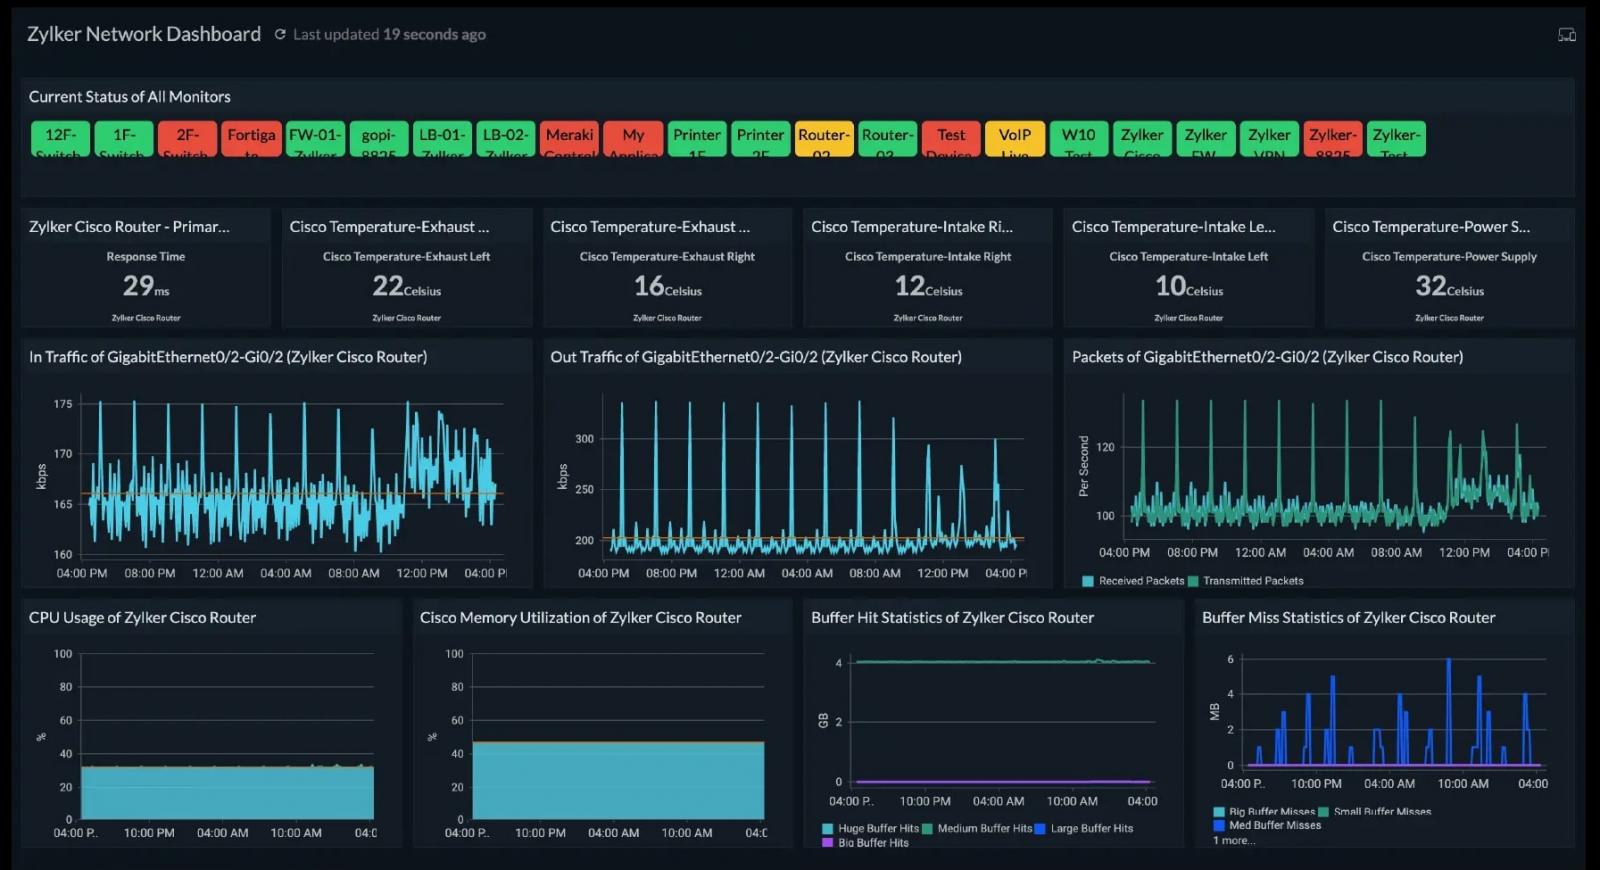
5. Paessler PRTG Network Monitor (FREE TRIAL)
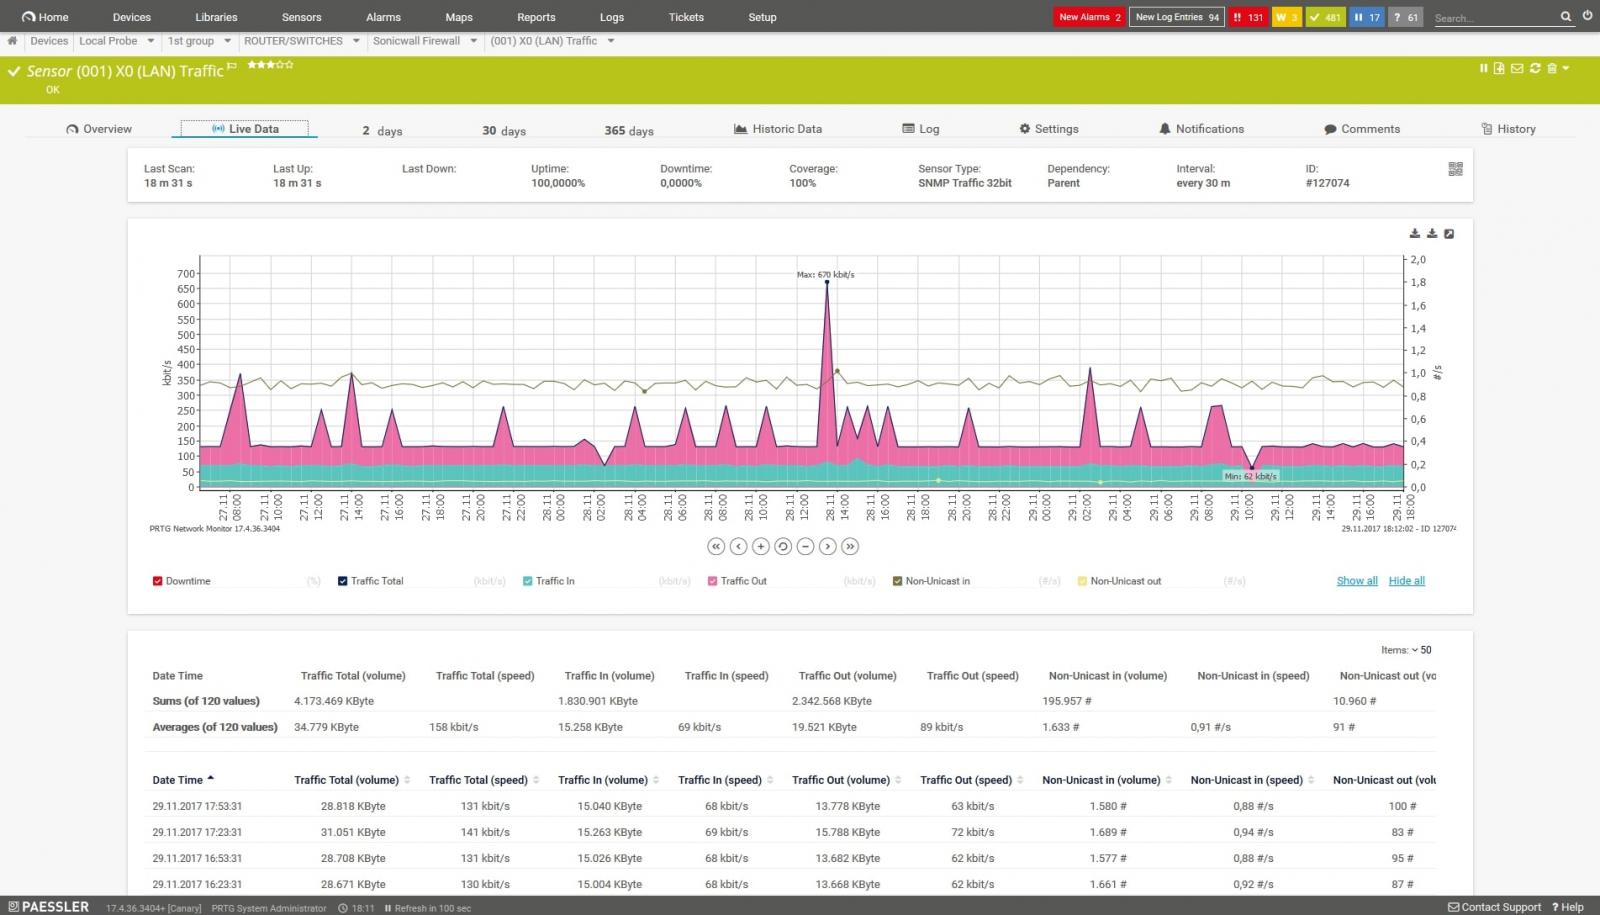
Paessler PRTG is a large bundle of network, server, software, and cloud system monitoring tools. The buyer chooses which of the sensors in the package to activate and the system is priced in bands of sensor allowances. The services in the bundle include SNMP-based device monitoring and traffic analysis mechanisms that use flow protocols.
Key features:
- Network discovery: Generates a hardware inventory and a topology map
- SNMP-based device monitoring: Also processes SNMP Traps into alerts
- Flow protocols: NetFlow, IPFIX, sFlow, and J-Flow
Why do we recommend it?
Paessler PRTG is one of the most successful system monitoring packages on the market because it is so flexible. Every implementation gets network discovery, inventory documentation, and network topology mapping – these features are the core of the monitoring console.
Paessler PRTG provides a lot of options. For example, it also provides a packet sniffer as an alternative traffic analysis method. You can get the dashboard to show you top talkers and link overload. You can also get VoIP, QoS, and MOS metrics, NBAR, and protocol analysis.
Who is it recommended for?
PRTG will appeal to all sizes of businesses because of its scaleable price structure. Small businesses will be interested in the Free edition, which is limited to 100 sensors. The minimum order quantity for the paid package is 500 sensors.
Pros:
- Deployment options: A SaaS platform or as a software package for Windows Server
- Alert forwarding: Get notifications by email, SMS, Microsoft Teams notice, or Slack message
- Network testing: Use Ping and Traceroute tools for troubleshooting
Cons:
- Sensor counts can build up quickly: Sensors are counted per interface, not per device
Paessler PRTG Network Monitor is available as a SaaS package or for installation on Windows Server and you can get either version on a 30-day free trial.
6. Zabbix
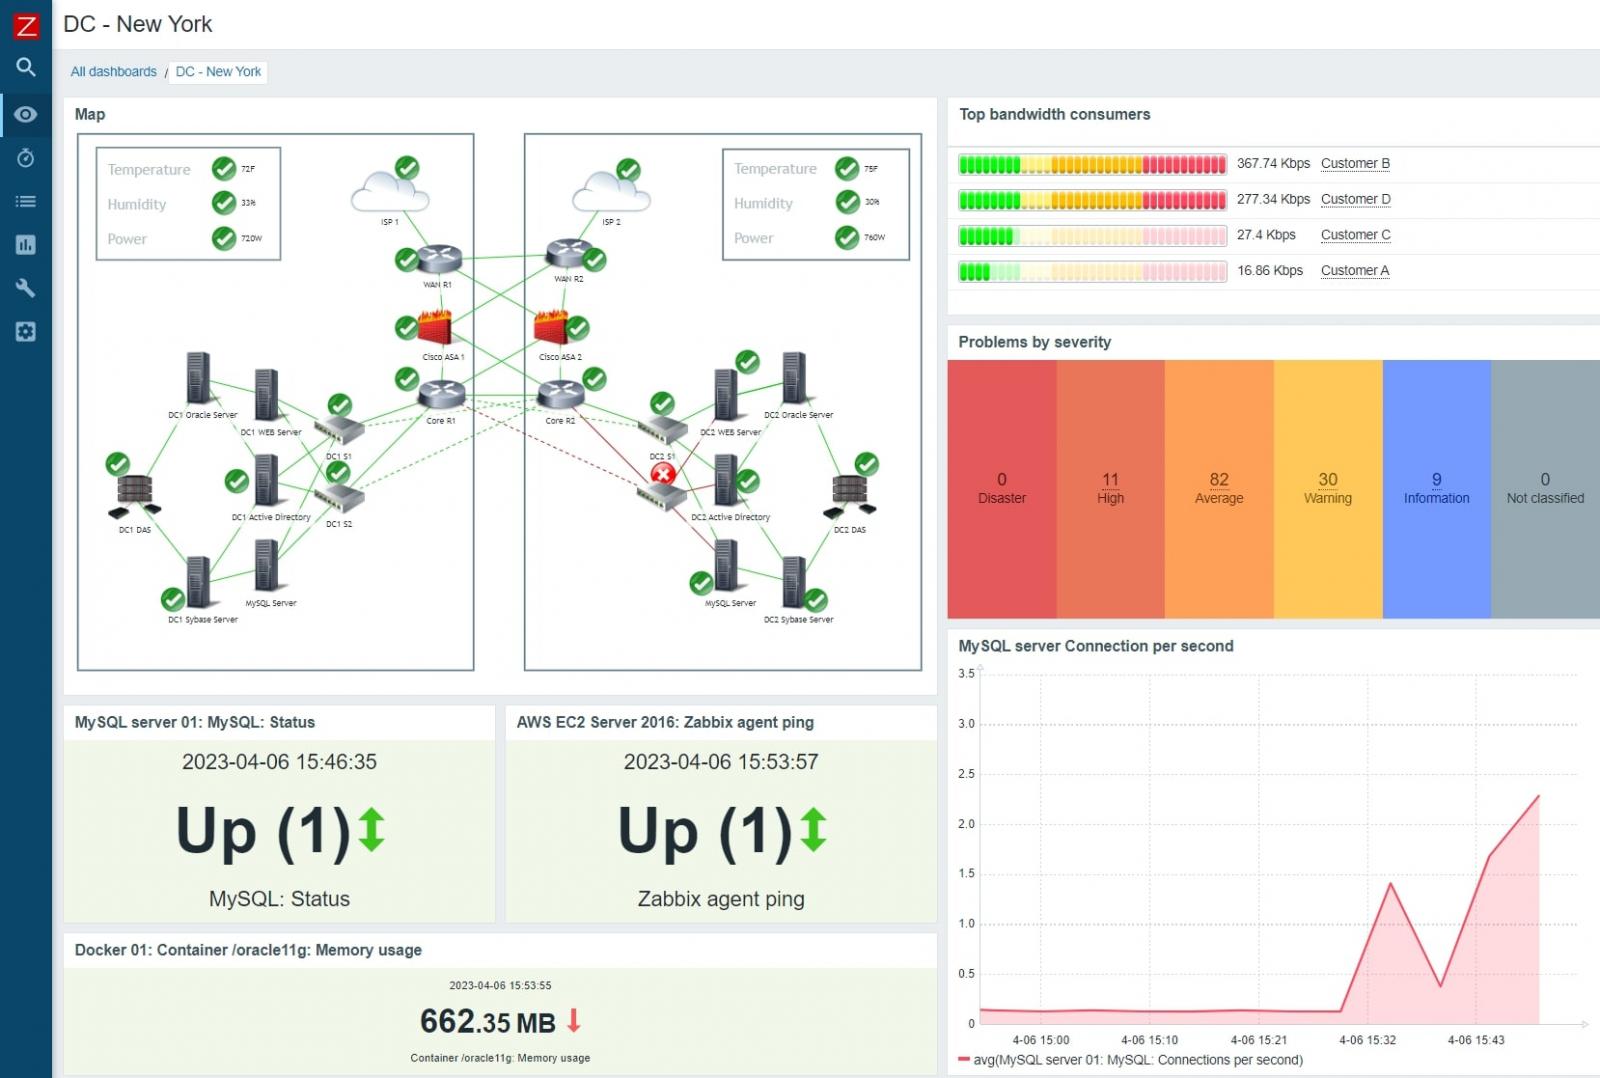
Zabbix provides network monitoring alongside server, cloud, and application monitoring. This is an on-premises package and it is completely free to use. Large companies that require a professional support package can sign up for a paid support package from the Zabbix team.
Key features:
- Network discovery: Constantly updated hardware inventory and network topology map
- SNMP monitoring: Checks on device health
- Netflow and sFlow statistics gathering: Implemented by a free plug-in
Why do we recommend it?
Zabbix is a free tool, which will appeal to companies that have little money to spend on monitoring tools. The package provides full-stack monitoring and even covers internet connection performance and cloud services activities. The console has attractive screens and you can create your own monitoring screen layouts and reports.
The alerting mechanism in Zabbix has an intelligent feature that cancels out warnings that relate to the same issue. This is a useful feature because a fault on a network device can trigger alerts in all of the assets that receive traffic through it.
Who is it recommended for?
Small businesses and startups on tight budgets will appreciate the $0 price tag of Zabbix. However, the package isn’t only for cash-strapped companies. The client list of the tool includes some very large and important organizations, such as Dell, the European Space Agency, and Orange. Technicians can adapt the software by writing extensions.
Pros:
- Alert forwarding: Set up notifications by SMS, email, Slack, PagerDuty, Webhooks, or Microsoft Teams
- Monitors virtual systems: Virtualizations, VLANs, virtual servers, and containers
- Website monitoring: Continuous availability testing with Synthetic Monitoring
Cons:
- Limited list of flow protocols: Only provides NetFlow and sFlow
You can download Zabbix onto Linux, macOS, or Unix.
7. Icinga

Icinga is an open-source IT asset monitoring package that was developed from another open-source monitoring system, called Nagios. This history means that the free plug-ins that are available from Nagios Exchange will also work in Icinga. This is a major benefit because the Nagios plug-in library is extensive. Icinga shares a network monitoring feature of Nagios in that it doesn’t include NetFlow collection. However, there is a workaround for that problem.
Key features:
- Network discovery: Creates a network inventory
- SNMP monitoring: Collects SNMP device health data
- Device problem notification: Processes SNMP traps through a Logstash plug-in
Why do we recommend it?
Icinga is an alternative to Nagios. The team that developed Icinga did so in protest of the Nagios project moving over to producing a paid version. That shows this project’s commitment to keeping its monitoring tool free to use.
While Icinga doesn’t collect NetFlow data, it can be set up to ingest this data through its ntopng plug-in. Ntopng can be set up to gather NetFlow and sFlow data from switches and then forward that to Icinga. The ntopng plug-in for Icinga acts as a receiver for these feeds.
Who is it recommended for?
Icinga has a loyal following and many believe it is better than Nagios Core. The tool isn’t quite as easy to set up and use as Zabbix. Prospective users of Icinga should maybe compare it to that other free tool before fully committing.
Pros:
- Flexible system: The software code can be customized
- Full stack monitoring: Combine network monitoring with server and software performance tracking
- Nagios compatibility: Takes Nagios plug-ins
Cons:
- Difficult to set up: The package is not as easy to manage as Zabbix
The Icinga software will run on Debian, Fedora, Ubuntu, CentOS, RHEL, openSUSE, and SLES Linux. You can also get it for Windows and it can be installed on an AWS virtual server. Download Icinga for free.

Did you know
The following information is available to any site you visit:
Your IP Address:
Your Location:
Your Internet Provider:
BLEEPINGCOMPUTER RECOMMENDS:
Using a VPN will hide these details and protect your privacy. We recommend using NordVPN - #1 VPN in our tests. It offers outstanding privacy features and is currently available with three months extra free.

Post a Comment Community Rules
You need to login in order to post a comment
Not a member yet? Register Now